6. Overview of research: Typography
Introduction
This chapter adopts the same approach as the previous chapter on type by including the context and objectives of the research.
Letter spacing
In Chapter 2 I introduced ‘crowding’ which refers to the effect of surrounding letters in words on the ease of identifying letters. It is easier to identify single letters if they are not in a word because the adjacent letters can jumble the appearance of letters. This suggests that increasing the space between letters would improve word identification, due to making it easier to identify the individual letters and accurately locate their position in relation to one another (e.g. to avoid confusing casual and causal). But if too much space is used, the letters may not be perceived as a group, i.e. a word. Another possible disadvantage of increasing letter spacing is that upcoming words, those we are about to read that are in our parafoveal vision, will be even further away from our fixation and therefore our acuity will be reduced.
A font has character widths (including space) built into it and most text processing software will have some way of adjusting the letter spacing from the default (0) value. Research exploring deviations from the defaults has produced the consistent finding that tightening (decreasing) letter spacing makes reading more difficult. However, increasing spacing has resulted in contradictory results: either no benefits or some benefit. This divergence can be explained by differences in readers, typefaces, method of testing, and amount of spacing.
Studies which use Courier, a monospaced typeface, found that tighter than standard spacing reduced reading speed but increasing beyond the standard did not increase reading speed (Chung, 2002; Yu, Cheung, Legge, and Chung, 2007). There was no evidence that the effect of crowding was reduced by increasing beyond the standard spacing. Using Courier is an odd choice from a designer’s perspective but it is easier to specify and manipulate space with each letter occupying the same fixed width. However, this property may be the reason why there is no advantage to increasing letter spacing beyond standard. Monospacing (fixed width) results in looser spacing, particularly for narrower letters, and therefore might not need additional spacing, particularly as this means that words will extend further into our peripheral vision (Figure 6.1). The adjustments to letter spacing are also rather large compared with later studies.
Figure 6.1: The monospaced typeface Courier used by Chung (2002). The standard spacing appears quite loose.
More recent studies have included adult skilled readers, young readers (7–8 and 9–10 year olds) and young readers with developmental dyslexia. Words set in 14 point Times New Roman with additional spacing (see Figure 6.2) are identified faster than the default spacing. This is true for all three sets of readers. However, when a reading task is used (not just single words) the advantage for wider spacing is only found with dyslexic readers. The reason why these different groups of readers were compared is because crowding tends to be greater for younger readers compared to adults and greater for dyslexics than normal readers (Perea, Moret-Tatay, and Gómez, 2011; Perea, Panadero, Moret-Tatay, and Gómez, 2012).
Figure 6.2: Default spacing (top) and wider spacing (bottom), described as increasing the value in Microsoft Word to 1.2 (Perea et al., 2011, 2012).
This relationship between increased crowding and spacing has been further explored by measuring the extent of crowding in individuals and looking at the corresponding effect of increasing letter, word, and line spacing (Joo, White, Strodtman, and Yeatman, 2018). Normal spacing consisted of words set in 11 point Calibri and spacing was increased by using 11 point Fluent Calibri (see Figure 6.3). A sub-group of adults with dyslexia who showed greater effects of crowding read faster with the additional spacing. This study did not determine whether letter, word, or line spacing is responsible for improving reading performance.
When 5–7 year old children were tested in a more natural reading environment, changes in letter spacing from tight to very wide had no effect on reading rate or errors (Reynolds and Walker, 2004). The children were asked to read aloud from a text set in 19 point Century Educational typeface which is used by publishers of early readers children’s books.
With adult readers and more subtle changes in letter spacing (see Figure 6.4), responses get faster as spacing increases. Reading sentences, we fixate for a shorter time if there is more spacing (Perea and Gómez, 2012a, 2012b). However, when adults read in a more natural context (reading stories for comprehension), there is no difference in overall reading time between default spacing and expanded spacing (1.2), as in Figure 6.2 (Perea, Giner, Marcet, and Gómez, 2016). Although fixations are shorter with the extra space between letters, slightly more fixations are made which cancels out the advantage. The saccade length is similar in the default and expanded spacings. As we are used to reading the default setting, and initiating saccades of a specific length, the question remains as to whether we might adjust the number of fixations if we read the expanded text for longer.
Research has confirmed that relatively small adjustments to letter spacing will affect single word recognition in different ways depending on whether the typeface is proportional or fixed width (Slattery, Yates, and Angele, 2016). When letter spacing is increased:
-
Words in proportional width typefaces (Calibri, Cambria, Georgia, and Verdana) are responded to faster.
-
Words in fixed width typefaces (Consolas and Courier New) are responded to slower. This confirms the earlier studies described above which also used Courier.
This study found no differences between serif and sans serif typefaces. This may be because the default spacings are adjusted appropriately (see Figure 6.5).
Figure 6.3: Examples of word lists used by Joo et al. (2018) with normal spacing in Calibri (top) and increased spacing in Fluent Calibri (bottom).
Figure 6.4: Interletter spacing of -0.5 (condensed), 0 (default), +0.5, +1.0, +1.5 (expanded) used by Perea and Gómez (2012a).
Figure 6.5: Comparison of proportional and fixed width typefaces with three letter spacings: tighter than default, default, and looser than default. This range of letter spacing is similar to that used by Slattery, Yates and Angele (2016). The typefaces are (top to bottom) Calibri, Cambria, Georgia, Verdana, Consolas and Courier New.
In summary, there is some evidence that slightly looser letter spacing helps dyslexic readers and possibly other readers, but this will depend on the typeface. E-books might therefore benefit from including control over letter spacing, particularly for dyslexic readers. Adults spend less time on individual fixations with looser spacing but more fixations are made. It therefore looks as though the defaults determined by type designers are appropriate even though they are not based on empirical research.
Word spacing
In the studies above where sentences were read, word spacing increased when letter spacing increased. Microsoft Word also automatically adjusts spaces between words when the user changes letter spacing (see, for example, Figure 6.4).
Word spaces allow us to segment text into words and help us target where to land our eyes, based on parafoveal vision. The space before the first letter of a word and space after the last letter also reduce crowding effects. All of these factors argue for having quite large word spaces. But there is a disadvantage as increasing word spaces pushes words further into our peripheral vision where our acuity drops off sharply. If letter spacing is reduced but word spacing increased, upcoming words are not pushed further into peripheral vision (see Figure 6.6). One study which used these spacings with Georgia and Consolas (a fixed width sans serif) found a benefit from reducing letter spacing (a little) and increasing word spacing. However, this was mainly with Georgia, rather than Consolas, which can be explained by the default spacings (see Figure 6.5). Georgia has tighter word spacing and so can benefit more from an increase than Consolas (Slattery and Rayner, 2013).
This relationship between word and letter spacing was explored further by Slattery, Yates, and Angele (2016) using Calibri and Consolas to compare proportional and fixed width typefaces. They confirm the importance of considering letter and word spacing together and propose that spaces between words should be at least 3.5 times the spaces between letters for efficient reading. As with letter spacing, fixed width Consolas is read slower if word spacing is larger than default, unless letter spacing is reduced. Calibri is read slower if word spacing is reduced. Although this study involved reading sentences, the researchers point out that only single lines of text were used and more research is required using multiple lines.
In summary, when making adjustments to word spacing:
-
defaults built into different fonts and page layout software need to be taken into account
-
the relationship between letter and word spacing is important
-
characteristics of readers may be particularly relevant as younger readers and dyslexics are more susceptible to crowding effects
Alignment
Paragraphs of text are typically aligned on the left with the right margin either aligned to produce justified text or with a ragged right margin to produce unjustified text. Most studies have shown no differences in reading speed although fully justified text may be problematic for poor readers when set in short lines, i.e. 7 words per line, about 42 characters (see Figure 6.7) or even slightly longer, about 52 characters (Gregory and Poulton, 1970; Zachrisson, 1965). One study has looked at alignment in web pages but using a search for a link in a screen of text, rather than reading the text. Performance was better with left-aligned then justified text although participants preferred justified (Ling and van Schaik, 2007).
The main reason proposed for the reduced legibility of justified text is the uneven spacing, often described as ‘rivers’ of white. These larger word spaces are more likely to occur with:
-
short lines
-
lots of long words
-
wider characters
-
no hyphenation
-
less sophisticated control over word (and letter) spacing
The assumption is that eye movements will be adversely affected by this unevenness which might be due to the lack of rhythm. Another possible explanation is that larger word spaces push forthcoming words further into peripheral vision, reducing their acuity. These factors may be more important for poorer readers who have a smaller perceptual span (and who therefore make use of fewer letters to the right). These proposed explanations have not been tested, as far as I know. It is possible that the issue is not differences in legibility but aesthetic considerations.
Line length
Line length, sometimes described as line width, can be measured by:
-
physical length of the line (e.g. 15 centimetres), sometimes converted to visual angle by taking into account the viewing distance
-
number of characters per line (cpl) which can be varied by
1) changing type size, keeping physical length constant, or
2) keeping type size constant which varies physical lengthFigure 6.8 shows the various ways of changing line lengths.
Research into the relative legibility of different line lengths in print has led to recommendations that line lengths should not exceed about 70 cpl (Spencer, 1968). Various studies summarised in Tinker (1963) have been interpreted as supporting an optimal line length of 52 cpl (Rayner and Pollatsek, 1989, p118). The explanation given for the legibility of this moderate line length is that it is the outcome of a trade-off between two opposing factors. If line lengths are too long, the return sweeps to the beginning of the next line can be inaccurate. If the lines are too short, readers cannot make maximum use of their peripheral vision. However, recent studies have questioned whether inaccurate return sweeps are necessarily problematic.
Studies looking at line length on screen began in the 1980s but were constrained as to how they could change line length. They did this by changing the character density which meant characters of the same height but different widths, looking something like Figure 6.9.
An early study showed that smaller characters, with more characters per line (bottom of Figure 6.9) are read faster and more efficiently with fewer fixations overall (Kolers, Duchnicky, and Ferguson, 1981). The line lengths compared were 35 and 70 cpl. Around 20 years later, using updated screen technology, line length was varied by changing the number of characters of the same size (Figure 6.10). The study found that reading rate tended to get faster as lines got longer, surprisingly even up to 100 cpl (Dyson, 2004, 2005). Similar advantages for longer lines on screen were found when searching for words, rather than continuous reading (Youngman and Scharff, 1998; Ling and van Schaik, 2006).
However, a consistent finding is that long line lengths on screen are least preferred or judged as least easy to read. Moderate line lengths (around 50–70 cpl) are preferred which fits with preferences for line lengths in print. This makes sense as readers may make similar judgements regardless of whether they are reading print or from screen. Readers may also be judging what they frequently encounter in printed material as being easiest to read, i.e. familiarity determining perceived legibility. But why might there be an advantage in reading speed for long lines (up to around 100 characters) on screen whereas in print, a maximum of 70 characters is most legible? Here are some suggestions:
-
The subjective judgements might provide a hint. Long line lengths on screen look quite daunting and this may encourage faster less detailed reading, such as scanning or skimming. This is consistent with comprehension being poorer with long line lengths, compared with moderate length lines. In fact, Ling and van Schaik (2006) suggest that longer line lengths should be used for quick scanning and shorter lines when text needs to be read more thoroughly.
-
The mechanics of reading texts on screen might also influence reading time. If required to scroll through texts, a longer line length will require less scrolling as there will be fewer lines. If we read whilst scrolling, we won’t be slowed down by greater amounts of scrolling. If we don’t, long line lengths will be more efficient to navigate.
-
A question remains as to why long lines might be less problematic in terms of the accuracy of the return sweep from the end of one line to the beginning of the next. As mentioned above, we tend to sit further away from a desktop computer screen than printed material which means that a line of text has a smaller visual angle. This smaller visual angle may make it easier to locate the correct position for our eyes when we do a return sweep. Another possible explanation is that the scrolling provides a cue to locating the next line, the upward movement of text reducing the difficulty with long lines. However, this is only likely to work if we scroll slowly, and may therefore be less relevant to touchscreen interfaces used on smartphones or tablets.
Question: Are you convinced by any of the above suggestions? If you encounter a long line length on the screen of a desktop computer, do you adjust the settings? If so, why do you do this? Are you influenced by what you read in print?
Columns
Another means of varying line length is to set text in columns: multiple columns generally result in shorter line lengths. There are a few studies which have directly compared single and multiple columns in print. The context for much of this research was exploring academic printed journal designs which typically use multiple column formats. The findings were not entirely consistent:
-
an advantage for narrow column setting (Foster, 1970)
-
single columns read faster than double columns (Poulton, 1959)
-
no difference between a single column and double column (Hartley, Burnhill, and Fraser, 1974)
-
with children aged around 11–12 years old there was slightly faster scanning for items in two columns (around 53 cpl) compared to one column (around 115 cpl). However, the longer line length was not problematic (Hartley, Burnhill, and Davis, 1978).
In the early days of online versions of newspapers and magazines, column formats were typically used on the web, often as PDFs, until these were re-designed and tailored for screen viewing. In a comparison of one and three columns on screen (Figure 6.11), the single column (80 cpl) was read faster with no differences in comprehension (Dyson and Kipping, 1997). This provides further support for the advantage of longer lines described above.
Some interesting additional findings from the Dyson and Kipping study are:
-
The advantage for this single column was restricted to a younger age group (18–24 year olds). Those over 25 years old read each version at a similar speed. We surmised that the younger participants were more familiar with reading web pages (around 1997).
-
Comprehension was better for faster readers in the three-column version than for slower readers. We speculated that faster readers may use a different reading pattern and be able to scan narrow columns in an efficient manner to absorb information.
Figure 6.11: Comparison of a single column (80 cpl) and three columns (each of 25 cpl) used by Dyson and Kipping (1997).
Line spacing
A very early study indicated that increasing line space from no additional space (same as point size) to 7 points additional space led to faster reading; with more than 7 points, reading slowed down (Bentley, 1921). As the type sizes used were 6, 9 and 12 point, this is rather generous use of line space (see Figure 6.12).

Figure 6.12: An indication of the material used by Bentley (1921). The top row shows the three type sizes (12, 9 and 6 point) with no additional line space. The bottom row has the same sizes with 7 points additional space.
As discussed in Chapter 4, designers do not make decisions on individual typographic variables, but consider the relationship between these variables. The legibility of a particular line length may be influenced by the amount of line spacing. The problem of inaccurate return sweeps when reading a long line may be alleviated by introducing more space between the lines. Paterson and Tinker studied type size, line length and line spacing of print by systematically varying all three (summarised in Tinker, 1965). The results were expressed as ‘safety zones’ referring to limits of line length and line spacing within which legibility would be satisfactory. These were generally between 1 and 4 points with not too much variation according to line length or type size. What we may conclude from this is that line spacing should not be too tight. Different typefaces are also perceived as needing different amounts of line spacing to maximise their attractiveness or appeal for reading with sans serif and italic needing one point more than serif roman typefaces (Becker, Heinrich, von Sichowsky, and Wendt, 1970).
Such extensive research has not been carried out for reading from screen. Given the rather general outcomes, it is questionable as to whether it would be worth repeating for screen. One study with the objective of generating design guidelines for web pages compared Arial 10 point type set in single, 1.5 or double line spacing. The researchers found that the greater the line space, the better able participants were to locate hyperlinks within texts and their preferences also followed this pattern (Ling and van Schaik, 2007).
Locating hyperlinks is an information retrieval task which will not involve the same sequence of eye movements as continuous reading. It is plausible that words are more easily identified when there is more space above and below them. This seems to be confirmed by a study which looked at line spacing from the perspective of crowding (Chung, 2004). Crowding has been discussed above in terms of letter and word spacing, i.e. horizontal space, whereas this study looked at vertical space which designers call line spacing. The study looked at the speed of identifying words and the results indicated that an increase in space above and below words increased reading speed. If we look directly at the word so that it falls onto the fovea, we benefit from increases of about 1.25 to 1.5 the standard spacing (see Figure 6.13) and after that there is no additional benefit. However, for words in peripheral vision which we use to guide where we land our eyes following a saccade, even greater line spacing is beneficial. These effects are greater for smaller type sizes suggesting that line spacing should not be set at a consistent percentage of type size; small sizes need relatively more additional space. Although Tinker’s method and approach were very different, and the results expressed in a different way, there is some agreement with the crowding conclusions.
Figure 6.13: Variations in space above and below words (line space) used by Chung (2004). The study found that 1.25x to 1.5x the standard spacing (1x) increased the speed of identifying the middle word (bike).
These studies indicate that optimal line spacing may be similar in print and on screen. The benefits of generous spacing may be an aid to improving the accuracy of return sweeps in longer lines, but also a means of alleviating crowding from adjacent lines.
Paragraph denotation
The typical ways of denoting paragraphs are:
-
space between paragraphs
-
indented first line
-
new line but no indent
-
occasionally, indented first line and space between paragraphs
The first three of these formats plus no denotation have been compared with 11–12 year olds scanning a text for missing words (Hartley, Burnhill, and Davis, 1978). They found:
-
the version with space between paragraphs (1 in Figure 6.14) is scanned faster than the new line with no indent (3) and no denotation (4)
-
the version with additional space between paragraphs (1) is not scanned significantly faster than paragraphs denoted by an indent (2)
They conclude that as an indent uses less space, this is a more cost-effective solution for print.
There does not appear to be any research which has pursued ways of denoting paragraphs on screen. The cost is not a factor and typically space is used to separate paragraphs (as in 1).
Figure 6.14: Methods of denoting paragraphs used by Hartley, Burnhill, and Davis (1978): (1) additional space; (2) indented first line; (3) starting new line; (4) no denotation.
Question: How do you typically denote paragraphs in print and on screen? What criteria determine your decisions?
Headings
Headings have the function of structuring a text, signalling the topic covered in the following text, and providing an access point (i.e. to locate a particular section). To serve these purposes, headings need to be differentiated from surrounding text. In chapter 5, bold was considered as more appropriate than italic as a means of making words stand out. Comparing all capitals and bold, newspaper headlines were found to be located faster in bold lower case than all capitals (Poulton, 1967). The lower case x-height was matched to the height of capital letters as the typographic designer involved in this study considered these to be optimal for the setting (see Figure 5.19). The capitals were set at the size that were in current use in the newspaper. This approach was in keeping with the practical purpose of the research which was carried out at the request of the editor of The Times newspaper.
Research comparing different graphic treatments of headings is however very limited and there has been more emphasis on the linguistic function of headings in facilitating processing of text and improving recall (e.g. Hyönä and Lorch, 2004). We do know that the position of headings (embedded or in the margin) did not matter for 14–15 year olds (Hartley and Trueman, 1983). (Figure 6.15) We might therefore conclude that the two solutions are similar in terms of usability.
Figure 6.15: Two positions of headings used by Hartley and Trueman (1983): embedded (top) and in the margin (bottom).
One study took a different approach to identifying the most appropriate typography for headings in text by exploring how easy it is to visually discriminate among them using a set of cards (Williams and Spyridakis, 1992). They measured the time required to place 16 different heading treatments in order of importance. The assumption is that if we can do this quickly, this suggests that the headings are clearly different from each other and consequently, they would work in a text to indicate the hierarchical structure. The treatments used type size, position (centred, flush left, indented, embedded), underlining, and case. Type size was perceived as the most powerful cue to the hierarchical status of the heading, which is understandable as there is little ambiguity in this treatment: a larger heading means a higher level of heading. A more subtle finding is that their participants found it easier to make judgements when the headings varied along fewer dimensions (e.g. size alone versus size and position).
Some care should be taken in applying these results to practice as headings need to be differentiated from body text as well as from other headings. It may therefore be desirable to change at least two dimensions to identify headings (e.g. size, case, typeface or type variant) and indicate the hierarchy of headings through one change, possibly size. There may be an interesting difference in which variable is used in different countries. In Mexico, upper case is frequently used for headings.
The space above and below headings appears not to have been specifically investigated in an empirical study but the Gestalt laws of grouping and organisation can inform practice (Panel 6.1). The Gestalt law of proximity states that elements positioned closer together are seen as a group and perceived to be more closely related than other elements in the image or display. Headings need to be seen to relate to the text below, rather than float between paragraphs or appear to group with the text above. To enable this grouping, there needs to be more space above a heading than below (Figure 6.16).
Overall layout
Some studies have taken a global approach by looking at layouts which vary a number of different features, acknowledging the importance of the relationship between typographic variables. Two approaches have been used:
-
identifying dimensions, constructs or variables used to make judgements
-
measuring the effects of ‘good’ and ‘poor’ layouts
Identifying dimensions, constructs or variables
A study (Grabinger, 1993)
aiming to identify constructs which would
inform the design of screens used a notation system
(Twyman, 1981) to present
examples to participants (Figure 6.17). An x denotes the
typographic norm and o a variation from the norm. The
typographic variables tested included various combinations of line
length, number of columns, line spacing, and paragraph denotation.
Participants judged the readability and studyability of the screens
using paired comparisons (see Panel 4.5).
The results indicated that the
organisation of screens and their visual interest were relevant to
judgements and single spacing and two columns resulted in more positive
judgements. Because a number of variables differed across screens, the
individual contribution of line spacing and number of columns cannot be
identified.
Figure 6.17: Example of the method used to indicate the layout of a
screen by Grabinger (1993).
Headings are denoted by o and paragraphs by x.
Effects of good and poor layout
A number of studies have tested different versions of documents that are assumed to differ in legibility, based on previous research and guidelines. Two such studies comparing screen formats found no differences in performance measures but preference for an ‘enhanced’ format (Muter and Maurutto, 1991) or a ‘well-structured’ text layout (de Bruijn, de Mul, and van Oostendorp, 1992). A later study (Chaparro, Shaikh, and Baker, 2005) also looking at screens resulted in the same outcome: no difference in reading speed or comprehension but an enhanced layout was preferred, regarded as less tiring to read, and satisfaction scores were higher.
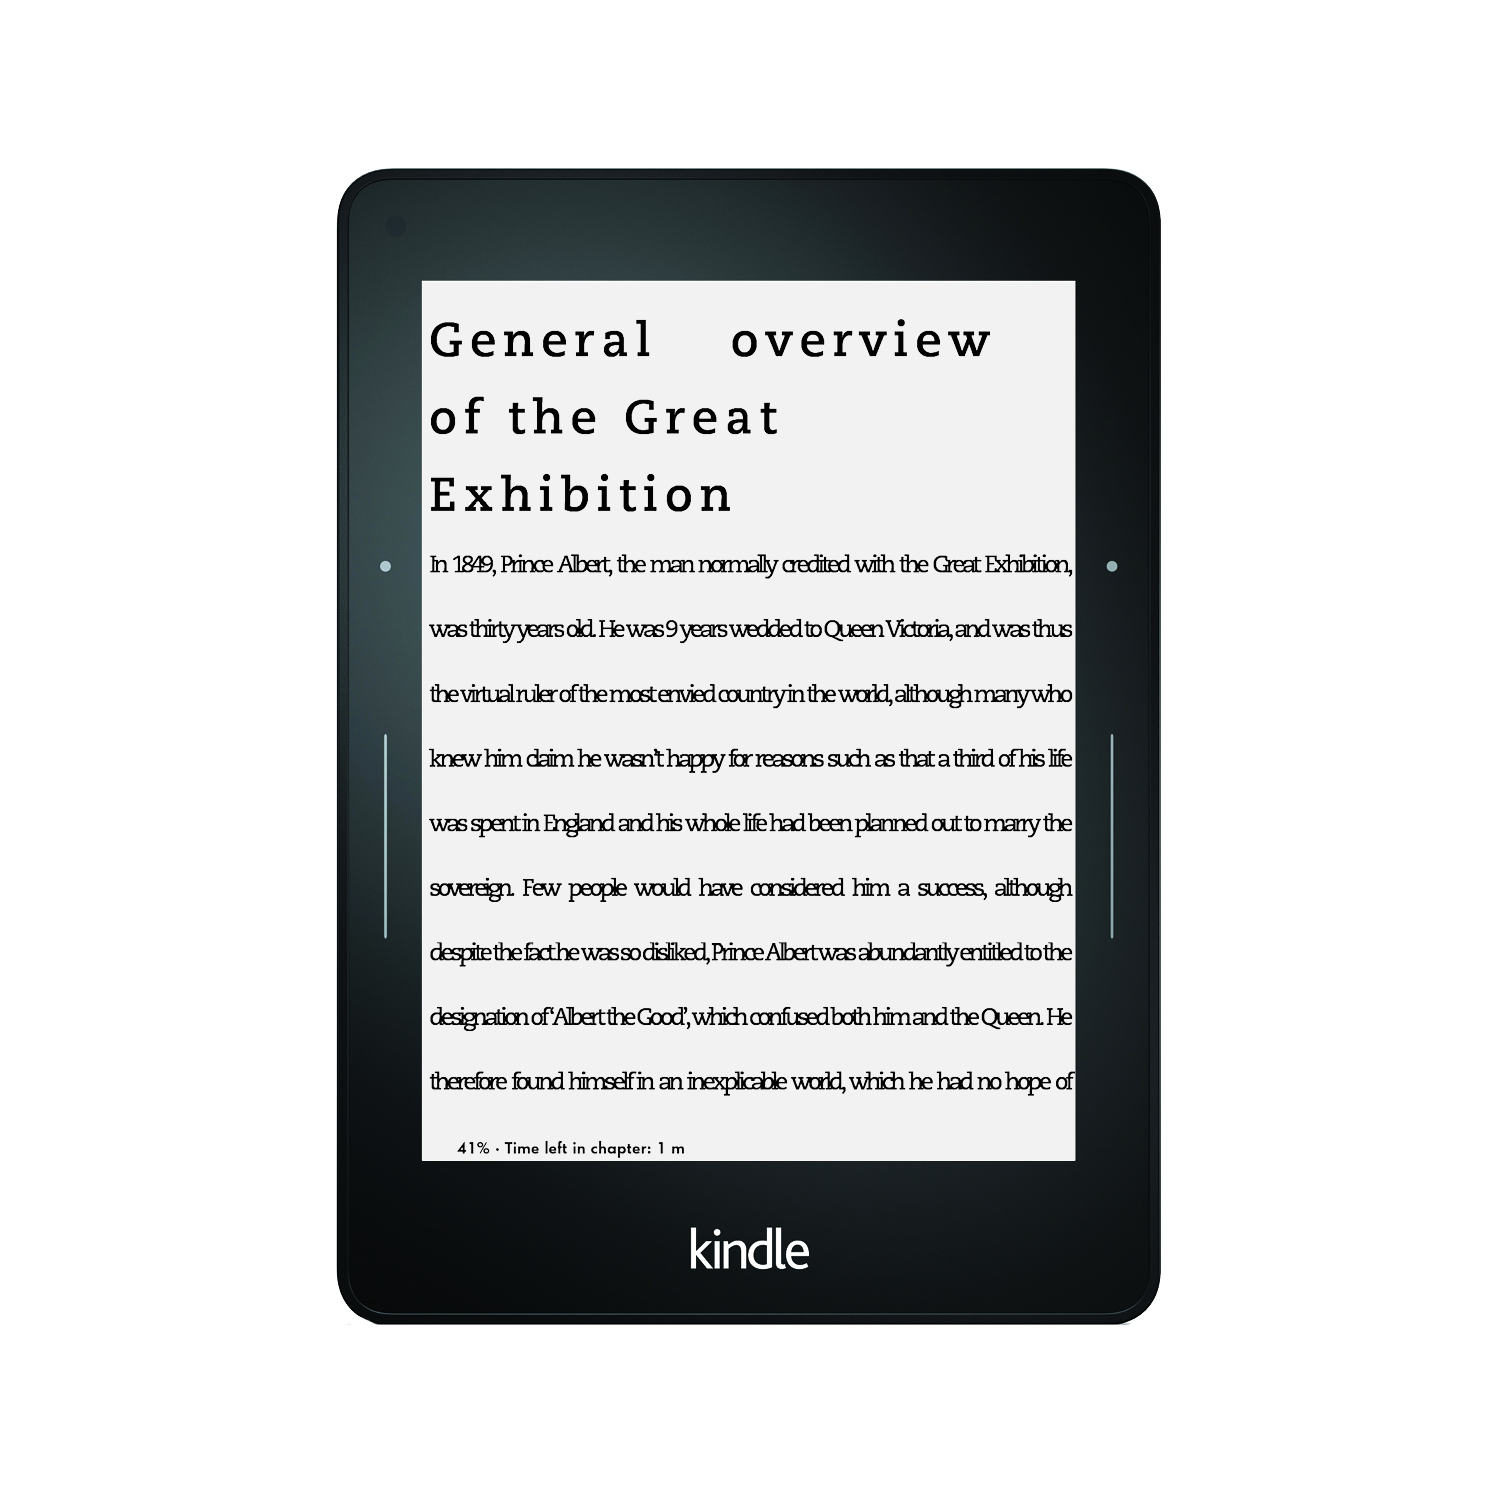
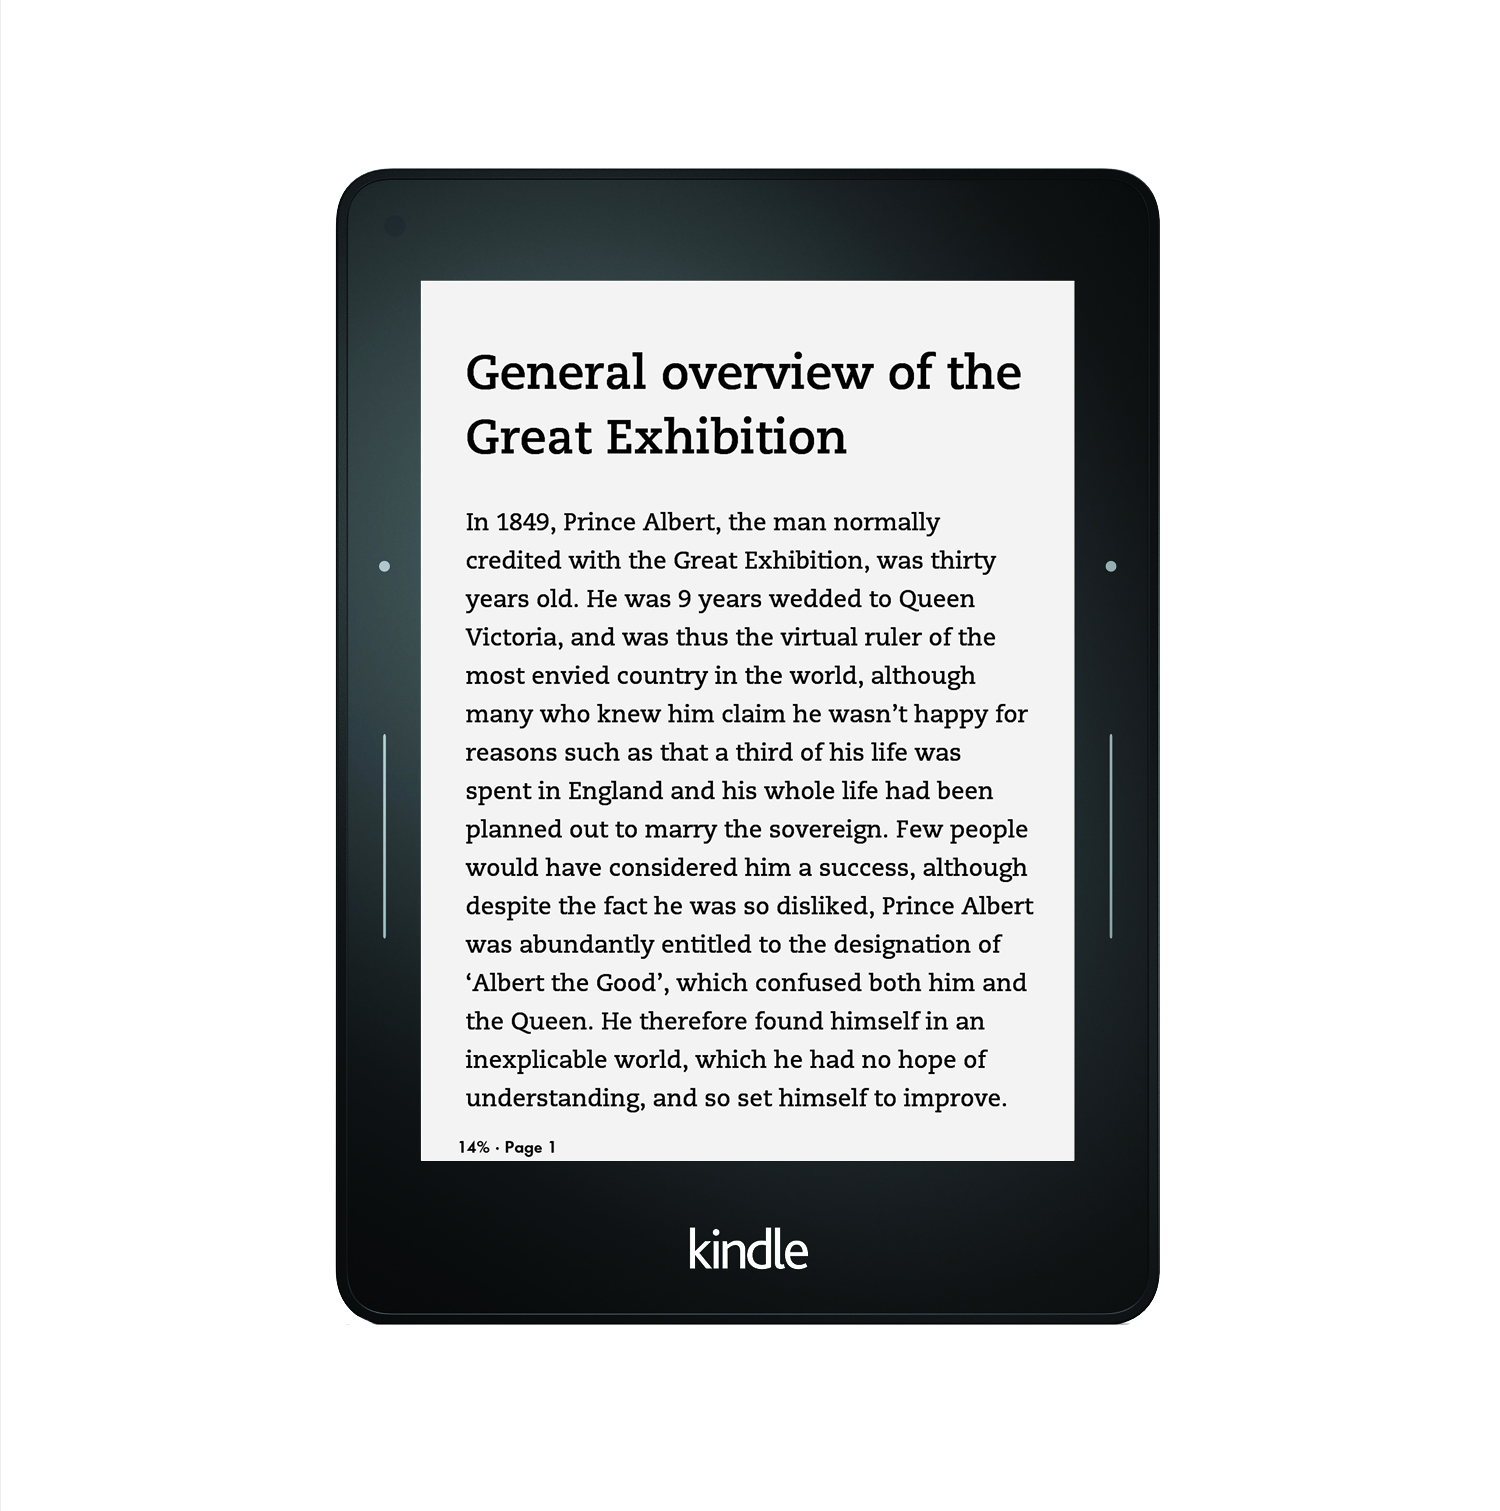
One recent study from an undergraduate dissertation at the University of Reading, UK (Moys, Loveland, and Dyson, 2018) did find performance differences between layouts varying in typographic quality. The ‘good’ layout was read faster and there were differences in the accuracy of recall. The results of this study are intriguing because the differences in recall depend on whether the participants read print or eInk (Kindle). The screen (eInk) version is as we would expect: more correct answers when the layout is better. But the print version reverses this result: recall is better with a poor layout. There is a possible explanation as to why a poor layout improves performance (introduced in Chapter 7) but it is difficult to explain why the results are different for eInk and print.
Question: Do you have any suggestions as to why the results are different?
Setting aside the lack of explanation for the outcomes, the study by Moys, Loveland, and Dyson (2018) found differences in both reading speed and recall, unlike the earlier studies. What might explain this divergence? The studies vary in many ways but the most obvious reason is likely to be the design of the test material. Unlike most of the research summarised earlier in this chapter which focuses on one typographic variable, these formats or layouts require the researchers to produce well-designed material as well as the, arguably, easier task of producing poorly designed material. Design guidelines need to be interpreted and decisions made as to how to combine variables. As discussed in Chapter 4, if the researchers lack design training, this is not an easy task.
The studies conducted in the 1990s did not illustrate their test material, which we know is fairly typical. Consequently, it is difficult to state with any certainty that the materials used were not appropriate exemplars of good and bad layouts. However, Muter and Maurutto (1991) suggest that some of their ‘enhancements’ may have had a negative effect, for example indenting every other line (see Figure 6.18, bottom). This lack of a consistent left margin would probably create problems with return sweeps of the eyes.
Figure 6.18: Simulation of normal (top) and enhanced (bottom) formats used by Muter and Maurutto (1991).
The later study (Chaparro, Shaikh, and Baker, 2005) does include examples of ‘enhanced’ and ‘poor’ layouts which were created by ‘expert typographers’. An indication of the layouts is given in Figure 6.19. The most evident aspect of poor practice is the splitting of text around an image. In this case, the measures of performance may not have been sufficiently sensitive to detect differences. For example, participants were able to go back to the passages to look up the answers to comprehension questions, with some time constraint. This is much easier than needing to recall what has been read.
Figure 6.19: Simulation of the two layouts used by Chaparro, Shaikh, and Baker (2005).
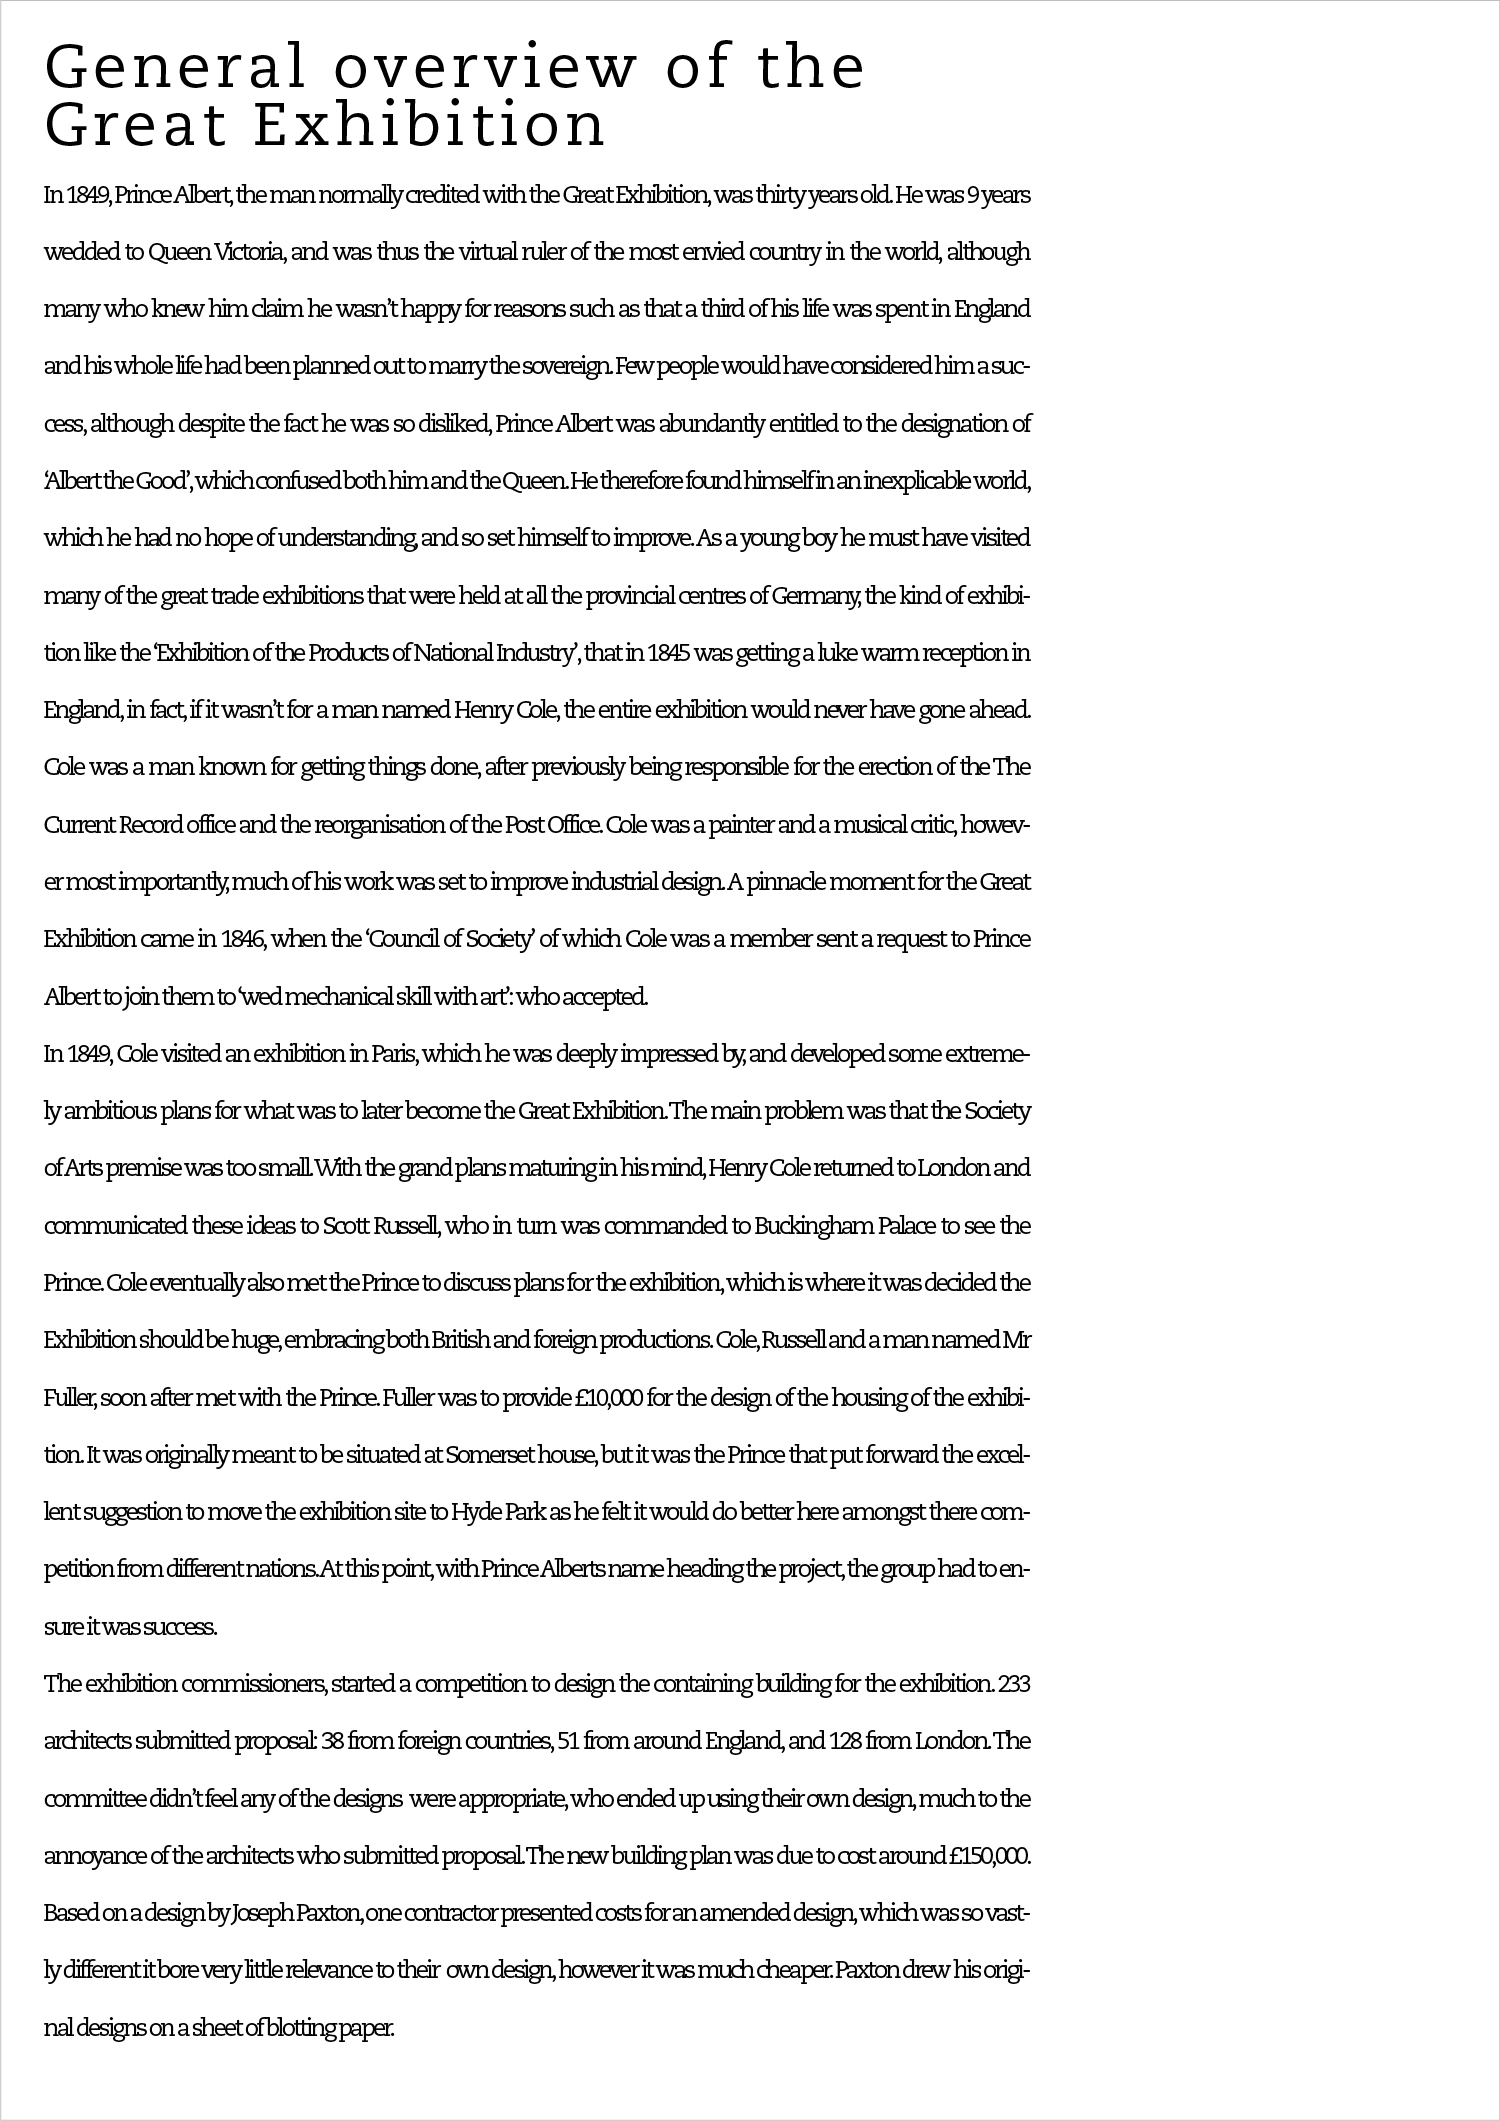
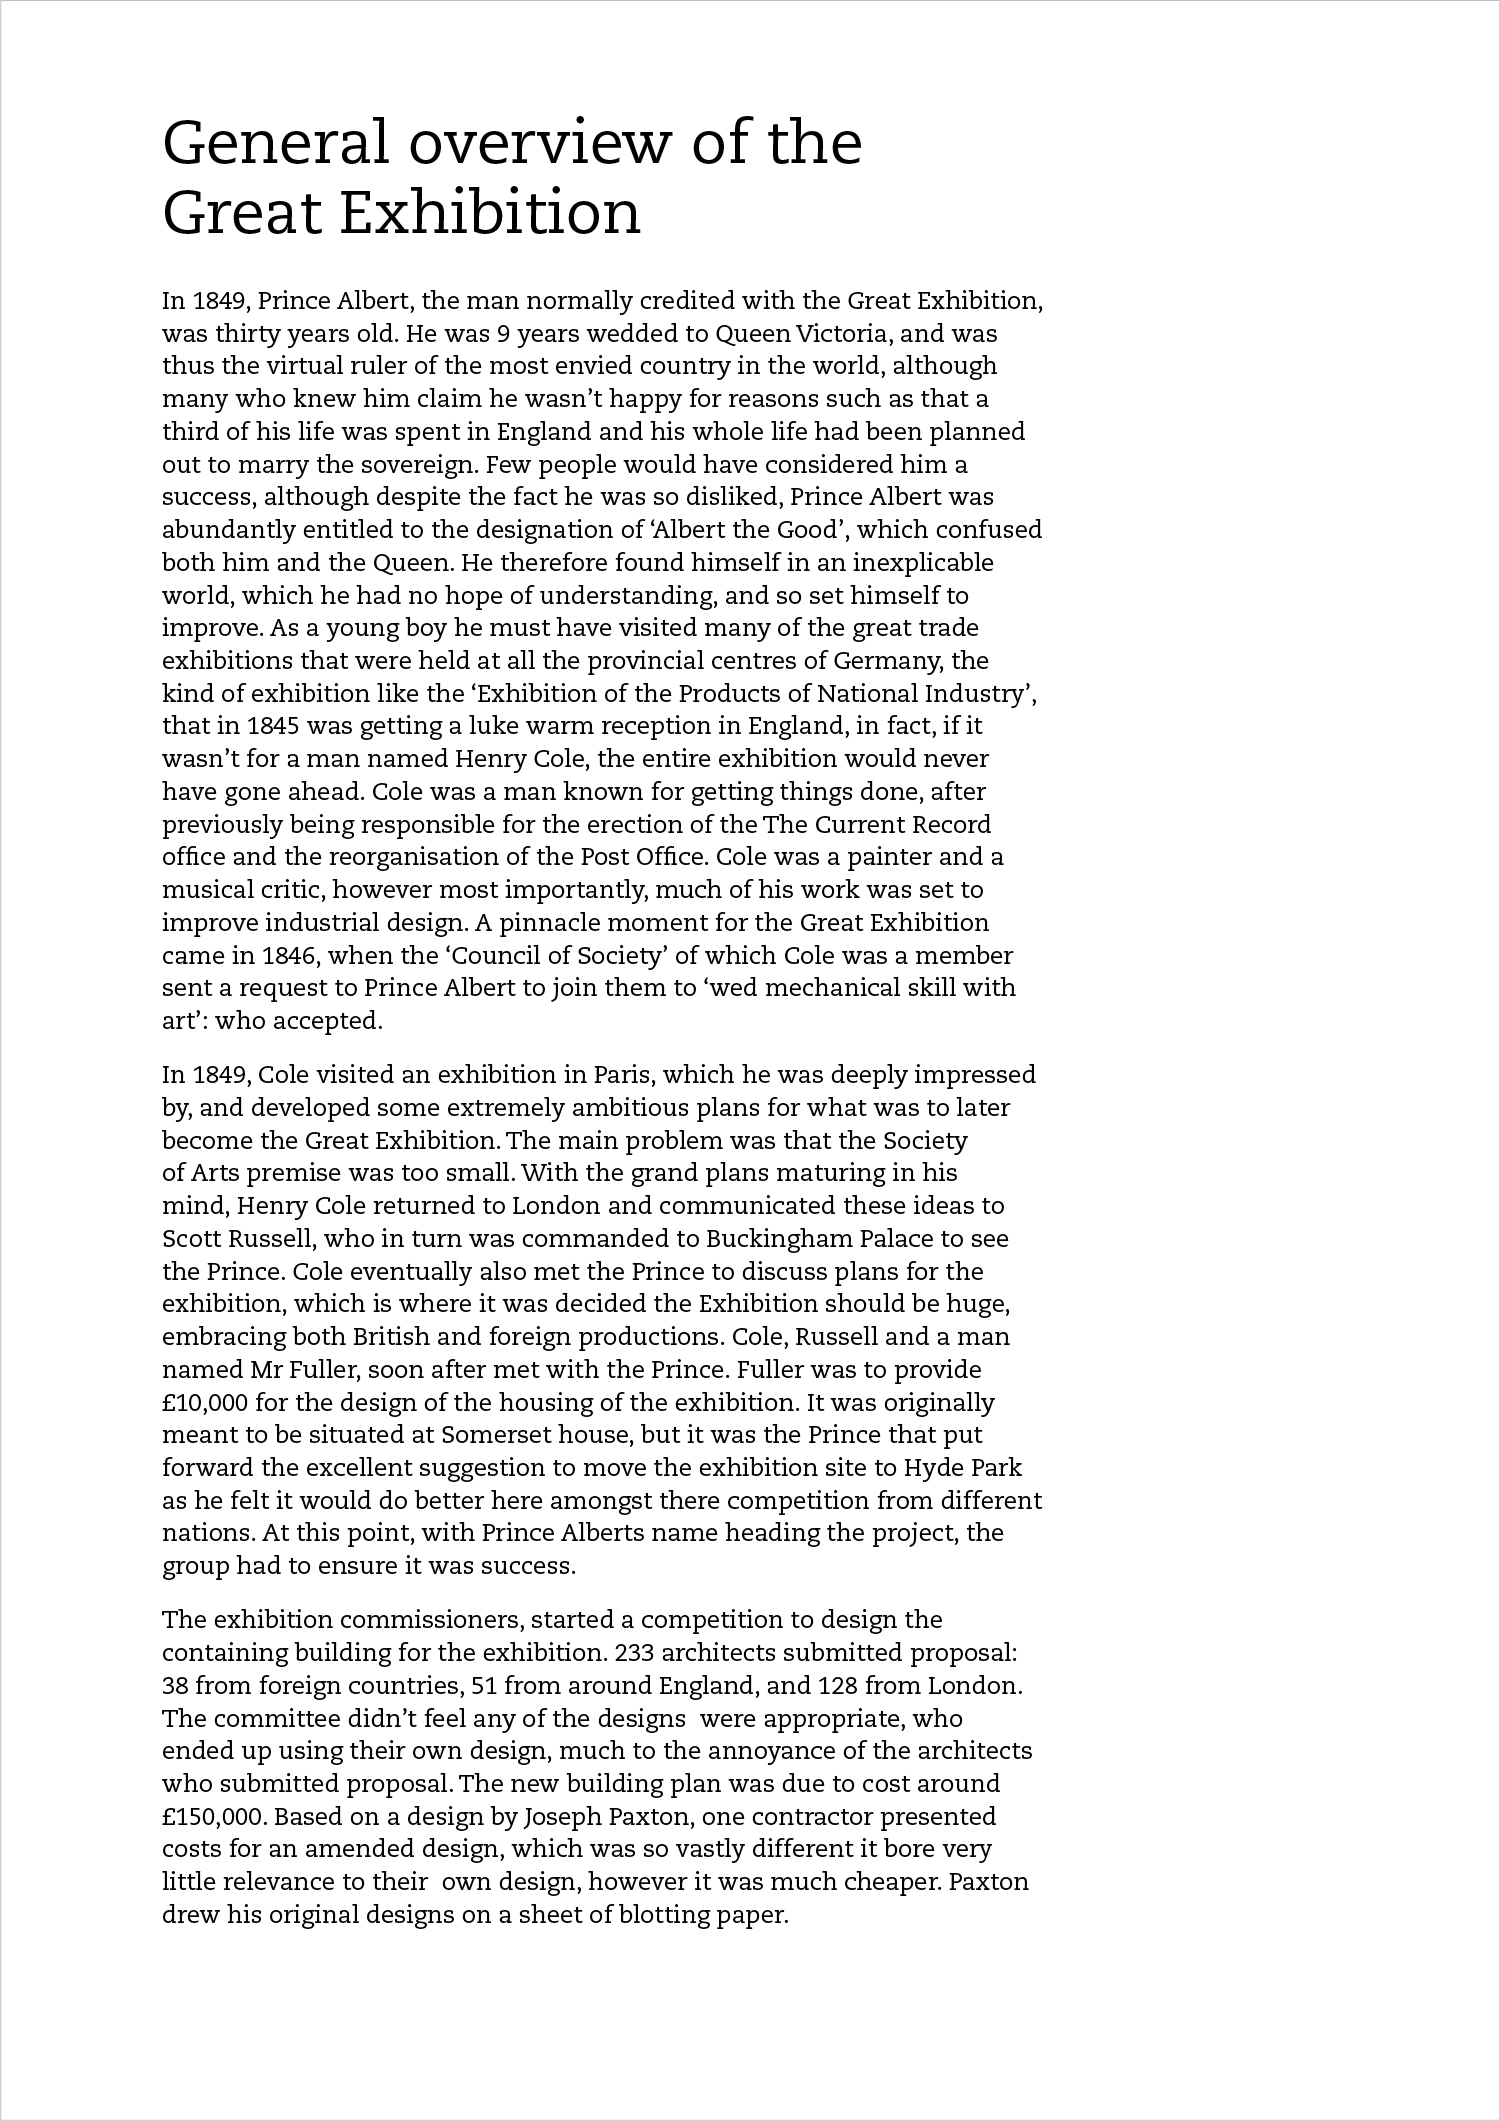
The test material used in Moys, Loveland, and Dyson (2018) was also designed by someone with typographic training (the student author, Loveland) and varied alignment, character spacing, line spacing, and line length. The exact same typographic treatments were not implemented for print and eInk. This would have caused both to have sub-optimal typography, when the aim was good typography, and so would have been an unnecessary compromise. Suitable typography for each was therefore used. Poor typography used justified text (to introduce inconsistencies in word spacing) tighter letter spacing, greater line spacing, and a substantially longer line length (see Figure 6.20). The optimisation of the layouts for the good examples, and manipulation of many typographic attributes in creating the poor layout, may account for the differences in performance. Also, a delay was introduced between reading the text and answering multiple choice questions (without referring back to the texts) which may have increased the sensitivity of this measure.
a) eInk poor layout
b) eInk good layout
c) print poor layout
d) print good layout
Figure 6.20: Four versions of text used by Moys, Loveland, and Dyson (2018): (a) eInk poor layout;( b) eInk good layout; (c) print poor layout; (d) print good layout.
Despite the positive reasons for including multiple variables together in one study, most of the outcomes have rather limited value in informing us of how to design to optimise legibility. They do indicate that participants (readers) can judge which layouts are better, or rather their judgements agree with the researchers’ judgements.
Questions: Explain the difference between participants’ ability to judge which layouts are more legible and their judgements agreeing with researchers’. Why might this distinction be important?
Summary
The overviews in chapter 5 and 6 are not exhaustive as there are factors which affect legibility, such as contrast of type to background, reversed out type, and size of margins, which have not been covered. I do not have a clear rationale for excluding these, other than to suggest that the research is rather limited and seems less relevant to current practice.
You will probably also have noticed that there are varying amounts of research depending on the typographic attribute or variable. I would not say that I have covered every research study but this unevenness probably does mirror, to a reasonable extent, the relative volume of work in each area. We might, therefore, ask why isn’t there much work on paragraph denotation? I can speculate that because the research that exists does not show any differences, it is of less interest to other researchers. Unlike some areas of research which can inform models and theories of reading or overlap with other disciplines, the treatment of paragraphs has direct application to design practice but little theoretical significance. It is therefore falls to applied researchers to pursue this topic. In other areas, valuable insights emerge from combining results from different types of researchers with different objectives.
Along with the uneven coverage, there are discrepancies in the reliability and informativeness of the research. This is particularly the case where little research exists or there are contradictory results. In such cases, you may be left to make up your own mind about what to take away from the overview, but I hope I have provided some guidance.
In researching for this text, I was excited to discover a very large number of studies published by a Spanish Professor of Psychology at the University of Valencia: Manuel Perea. You will have seen his name cited quite a few times in the overviews. This research encouraged me as the majority of legibility studies have been carried out in English and with participants who are familiar with typographic conventions in the UK or US. In a couple of places in this text, I have mentioned conventions that may differ in Mexico (thanks to my editor). Although the studies by Perea are done in Spain, they are extending the generality of the results to the Spanish language and Perea is keen to consider any possible influence of the language on the results (though not the typographic conventions).
Along with his fellow researchers, Perea has recognised the potential importance of typographic factors in reading and explored:
-
upper versus lower case
-
interletter spacing
-
upper versus lower halves of letters
-
bold type
-
serif versus sans serif
I am therefore hopeful that this recent interest from various groups of researchers encourages others to delve further into the effects of typography on reading to inform practitioners.